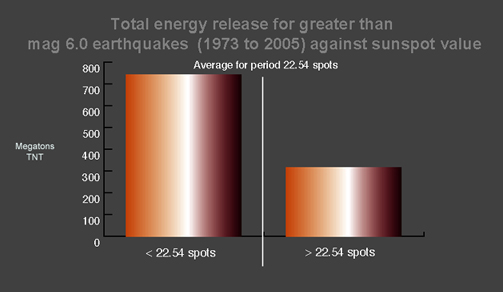
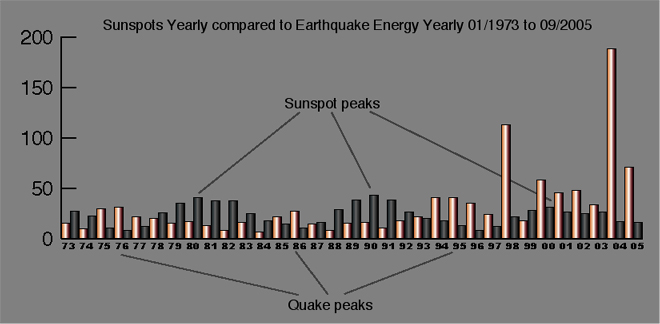
Research shows that large earthquakes occur at low sunspot frequencies. A sample of global earthquakes greater than Magnitude 6 for the period 1973-2005 (USGS) compared to smoothed monthly sunspot figures (SIDC) show that 71% of earthquake energy is released and 59% of earthquake events occur at lower than average sunspot activity.
Overall the data also broadly supports the assertion that the larger the earthquake size the lower the average sunspot frequency at the time. Further the top 12 largest earthquakes over the past hundred years (USGS) on average occurred at lower than average sunspot levels.
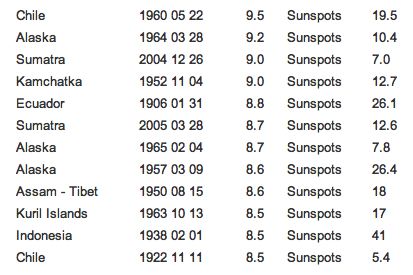
Average sunspot count of 16.99 for top 12 earthquakes in the last century
Average sunspot count for period is 22.45
This all strongly infers a connection between sunspots and earthquakes.
It is speculated that the increase in solar activity during the cyclical high sunspot period is responsible for increased geothermal output on Earth. The lag from cause to effect the reason for the imbalance in earthquake energy output during lower sunspot activity.
The largest events occurring at even lower sunspot frequencies infers that the necessary energy accumulation before the release leads to a longer lag between cause and effect.
Support for this speculation comes from the Goddard Institute (NASA) where research by Richard Stothers has found that historic large volcanic eruptions also occurred at low sunspot frequencies.
So what do we have then? A new theory of Sun Earth interrelation or some biased figures. Perhaps it makes sense to study the speculated cause of the issue, the Sun and it’s spots. Conventional theory has it that the Sun is a self-generating dynamo with its pulsating sunspots generated by the differential rotation of its equator and its poles. The build up of energy then surfaces on the star in irregular bursts of spots an average 11.12 years apart, with this sub cycle also causing a 178 year cycle of 16 peaks. However sunspots have failed to materialise for long periods during minima which leaves the self-generating theory exactly where?
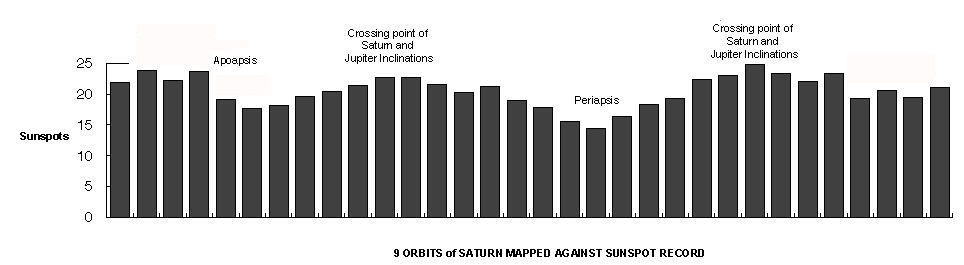
Jupiter orbits the Sun exactly 15 times in 178 years, 178 orbits of Earth, and that is precisely the time taken for 16 sunspot cycles, ok, give or take 9 hours. So a ratio of 15,16,178. Another planet is also involved in this synchronicity, Saturn, it orbits 6.043 times in 178 years. Take the orbit of Saturn and map it against the 250 year sunspot record and something interesting happens, the sunspot record shows cycles dependant upon Saturn’s position in its orbit and clear troughs appear when the planet is both closest and furthest from the Sun. The graph below shows a clear relationship between sunspot levels and the position of Saturn in its orbit. Further, it links with the relative position of Jupiter and illustrates part of the timing mechanism for the sunspots. Movements of the planets generate the Solar heartbeat and coincidentally our upwardly pulsing geothermal output.
How does this happen?
As the orbits of Jupiter and Saturn cross over due to their relative inclinations there is a zone of influence when their combined energies whether tidal or magnetic are more likely to impinge upon the Sun and stimulate a sunspot peak. The schematic below may help you visualise this though it is not to scale in any sense. Remember also that it is heliocentric, the Sun being the centre of the orbits. The speed of the planets is also of consequence with Saturn accelerating into the zone as it heads towards periapsis and slowing as it heads towards apoapsis thus the characteristics of each zone are slightly different and slightly displaced.
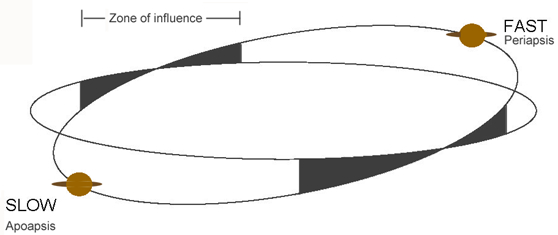
The third peak in the graph is just before Saturn is at apoapsis. It may well relate to what astrologers, those ancient students of planetary movements and Earthly happenings, called a trine, three points within an orbit 120 degrees apart. The third peak appears to be caused by the speed differential between the two planets as they speed up and slow down in their orbits causing the planets to remain conjunct for longer.
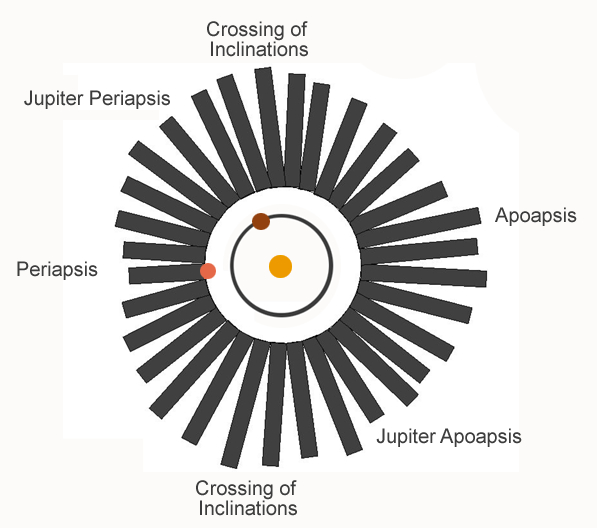
This is the same graph of the sunspots wrapped around the orbits of Saturn and Jupiter, as you can see an interesting shape is formed. The dip at Saturn’s periapsis relates to the speed of its motion, there being less chance of a conjunction with Jupiter, the inclinations crossing are marked by two bulges. The third bulge occurs as Saturn slows approaching apoapsis as there is a greater chance of a conjunction with Jupiter and decreases as Saturn begins to accelerate towards periapsis. Two other features are shown, Jupiter’s periapsis, as the inner planet is moving faster and increases the likelihood of conjunction with the outer planet and, apoapsis, which shows as a dip because Jupiter slows and reduces the likelihood of conjunction.
How then does this cyclicity produce sunspots on an 11.12 year cycle? Saturn with its 6 orbits in 178 years should produce 18 sunspot peaks ie 3 x 6 but only 16 appear, why? Because Jupiter goes out of synch twice in that period and drops a cycle; Saturn is in position but Jupiter isn’t. This can be seen within the vagaries of the sunspot peaks themselves with gaps as long as 17 years and as short as 7 years. Jupiter either missed the bus or caught an earlier one.
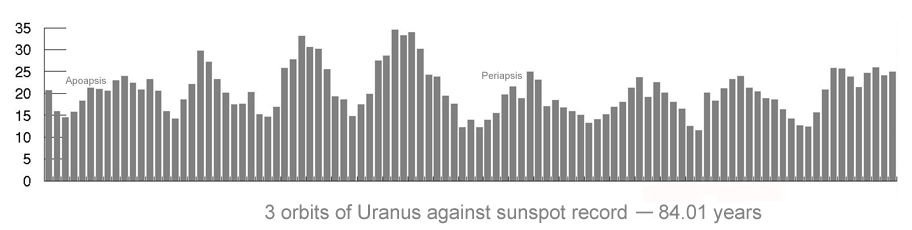
Interesting too is the following graph of Uranus against the SIDC sunspot record. It shows eight peaks but also a single phase as it climbs to a peak just before periapsis. The eight peaks relate to Saturn’s orbit with Jupiter and it should be noted that the difference in inclination between the orbits of Jupiter and Uranus is small therefore each conjunction is significant, the peak effect coming approximately 10 years before Uranus reaches periapsis. It is most likely the slow 84 year cycle which integrates with Jupiter’s orbit to produce the dropped cycle, 2 x 84 years, 168 years, would give the required loss of two cycles in the 178 year sunspot cycle.
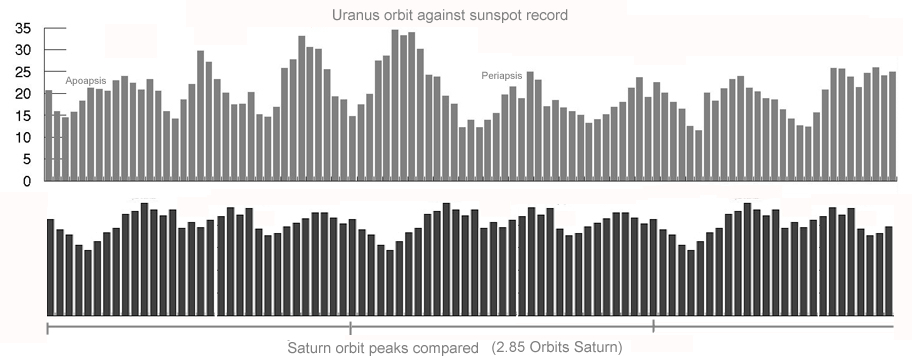
When the two graphs above are combined it becomes clearer that the peaks in the Uranus graph correspond to the peaks in the Saturn graph. It also demonstrates the combined effects of the different planetary signatures on the Sun.
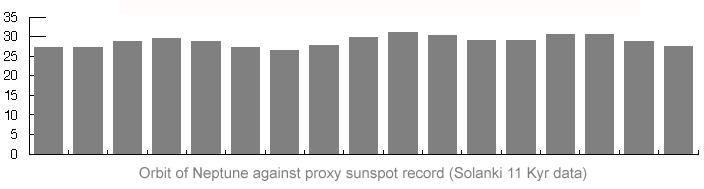
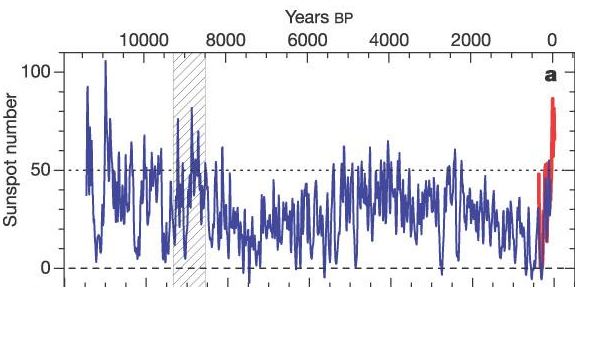
And finally the orbit of Neptune mapped against the Solanki et al 11,000 year proxy sunspot record derived from ice cores (see link below to NOAA Paleoclimate Survey). This posed a few problems relative to the data as the data is available in ten year sections. Neptune has a 164.75 year orbit so a precision fit of the data is tricky. Nonetheless it displays a very similar structure to the graph of Saturn and the peaks again appear relative to orbital inclination (again with Jupiter) and relative speed of orbit. The difference in orbital inclination is again larger (See chart above)
What does this mean?
The above four graphs demonstrate a link between the planet’s relative positions and the sunspot record. The prevailing scientific theory is that the planets do not affect the sunspots, the graphs suggest that they do, in fact, drive the sunspots. It appears that Jupiter, the largest of the planets, is the major factor with other planets combining with it to produce patterns of sunspot peaks which when coincident form the larger peaks we associate with the sunspot record. However, it seems likely that all of the planets are involved to a greater or lesser degree and a precision alignment of any two might significantly affect the sun’s output. It also indicates that sun cycles follow very long period patterns as the slower moving planets move into their most potent positions relative to each other only very rarely.
Astrology 1 – Science 0
So how did astrology get in on the act? Well astrology was something of an obsession with ancient civilisations, as they attempted to link planetary movements with Earthly events. But astrology didn’t get the clearest run, first the central repository of Eastern astrological information, the Library of Alexandria, burnt down, then the early Church expunged it largely because of the association between planets and paganism. Following this the conquistadors did for the Mayans and the major source of Amerindian astrology with their calendars and long tradition of astronomy. Finally, its watered down namesake appears in the amusement columns of lesser periodicals. Such a fate.
Which brings me to the long count, the 5125.257 year Mayan calendar, ending according to archaeologists around December 21st 2012, the culmination of the fifth period of a larger 25526.3 year calendar. Troubling is the Mayan assertion that this period coincides with a new Sun and the end of the world as we know it by earthquake.
This would be easy to brush aside as ancient myth until one realises that the 25526.3 cycle which the Mayans so elaborately designed can be divided by the 177.925 year sunspot cycle exactly 144 times. A sort of Hitchhiker’s Guide To The Universe moment.
The 5125.257 year cycle also contains whole orbit synchronicity between Mars (.015 orbit difference) Jupiter (.084) Saturn (.01) Uranus (.003). Bit of a coincidence then. Imagine, all those planets arriving back in the same orbital positions after a lapse of 25626 years and that being in accord with Mayan calendrics and prophecy.
Astrology 2 – Science 0
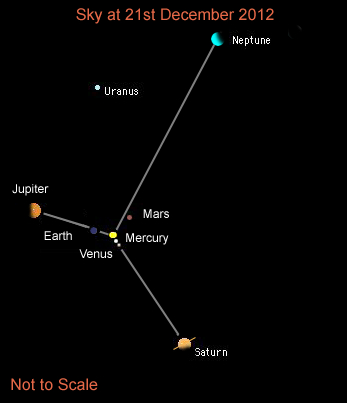
So what then is happening between the Sun and Jupiter to create the sunspots; a combined tidal effect, a focussing of magnetic fields on the Sun with the inner planet acting as a lens at the time of each synchronised pass of Jupiter and Earth, a shadow effect allowing the Sun’s energies to rise to the surface. Let’s look at the sky of December 21st 2012, mmmm. Jupiter, Earth, Sun in a line, Saturn, Venus, Sun in a line and Neptune, Mars, Sun in a line, auspicious wouldn’t you say. It couldn’t be they’re all beaming their energy at our Sun simultaneously as a prelude to a mega rash of sunspots which in turn lead to…uulp!
Sharp these Mayans, sharp as an obsidian blade.
But did they miss something or have the Conquistadors in plundering and destroying their culture and artefacts obscured the truth in their quest for gold. A potential parable for a here and now world.
Further down the chain of 178 year sunspot periods, further on than 144, lies 149, as different from 144 as can be imagined. 149 is a prime number, unlike 144 which is what mathematicians call abundant. One cannot divide 149, except of course by one, whereas 144 can be divided by 1, 2, 3, 4, 6, 8, 9, 12, 16, 18, 24, 36, 48, 72 and 144, truly it’s abundant. And what’s more, 149 only comes around once in 26511 years. Why would planets behave in this way. They occupy these ratios and frequencies simply because if they hadn’t they’d have wrenched themselves apart, collided, exploded or otherwise rejoined the mass of debris swirling around our fledgling Sun long ago. What you have are interplanetary motions that are either phased so the planets fail to conflict or, alternatively, consistent with larger primes where the potential conflict is avoided as these planets only meet upon very rare occasions. Now, after about 4 billion years some semblance of order prevails, though temporary. It’s simply awaiting the next interplanetary, interstellar pile up or near miss. And 2012 seems to represent that juncture.
If you take 26511 and divide it by 3, itself a prime, you get 8837, another prime number and this period coincides with a number of planetary whole orbits. Earth 8837(exact), Jupiter (.00754 orbit difference), Saturn (.000118). But the 3 cycles that make up the 26511 year cycle come in different flavours, with Mars, without Mars, with sunspots, with Venus etc. and it may be this variety of coincidence which determines the extent of any Solar eruption. Also of importance is where you begin and end your sequence. Whilst the planets will conform to these timings over any such period, as long as their orbital speeds remain stable, their relative position at the start and end of the cycle is all important. Go back from 2012, the next predicted sunspot peak, 8837 years using Solanki et al.(NAOO) proxy sunspot levels and you find the highest peak going backwards in time for, yep, you guessed, 8837 years. Coincidence, or a 9000/1 hole in one?
 So what are the potentials? Are we about to see a merger of the Mayan 25526 year cycle with a 26511 year cycle, a crossover of 144 cycles and 149 cycles, a collision of the abundant with the prime?
Certainly we can expect a peak in the sunspot cycle, geothermal upheaval, climate change, sea levels rising and disturbances to Earth’s geomagnetic status. All of these events are already noted as currently occurring. What we don’t know is the extent. Throughout the Solar system planetary changes are being noted, including a doubling of Jupiter’s magnetosphere. (See link below)
Throughout the
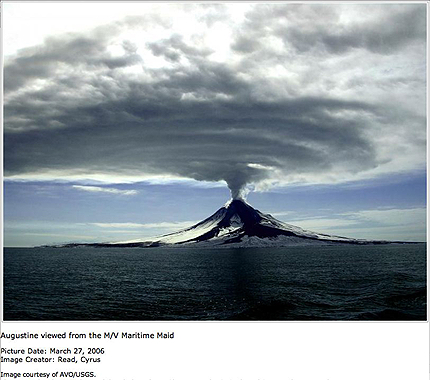
The above picture is of Mt Augustine in Alaska which is currently showing signs of activity. It erupted October 6th 1883, this is a contemporary description from the Alaska Volcano Observatory site (http://www.avo.alaska.edu/index.php):
“At about twenty-five minutes past eight A.M., or twenty-five minutes after the great eruption, a great ‘earthquake wave,’ estimated as from twenty-five to thirty feet high, came upon Port Graham like a wall of water. It carried off all the fishing-boats from the point, and deluged the houses. This was followed, at intervals of about five minutes, by two other large waves, estimated at eighteen and fifteen feet; and during the day several large and irregular waves came into the harbor. The first wave took all the boats into the harbor, the receding wave swept them back again to the inlet, and they were finally stranded. Fortunately it was low water, or all of the people at the settlement must inevitably have been lost. The tides rise and fall about fourteen feet”
On 27th August 1883 Krakatoa erupted off Java and Sumatra. The 1883 eruption ejected more than 25 cubic kilometres of rock, ash, and pumice, and made the loudest sound ever historically recorded by man it also killed 35,000 people with the tsunami it generated and and falling ash.
What links these events to Venus? Transits of Venus are the rare astronomical phenomena and currently occur in a pattern that repeats every 243 years, with pairs of transits eight years apart separated by long gaps of 121.5 years and 105.5 years. Before 2004, the last pair of transits of Venus were in December 1874 and December 1882. So nine months after Venus transited the sun, a direct conjunction of course, Krakatoa explodes and three months later so does Mt Augustine.
The first of a pair of transits of Venus this century took place on June 8, 2004, six months later on December 26th 2004 and the Sumatran undersea quake took place followed by a tsunami killing 230,000 people. Seven months later, in July 2005, St Augustine began its current eruption. The next in this pair of transits will be on June 6, 2012, it’s that year again, any bets that St Augustine is preparing to stage a rerun of 1883? And is Mt Merapi on Java about to become the next Krakatoa?
ogs
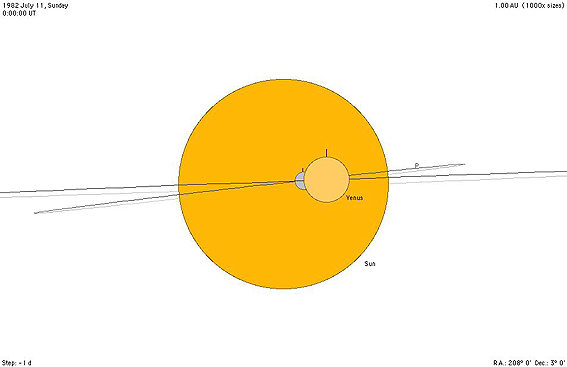
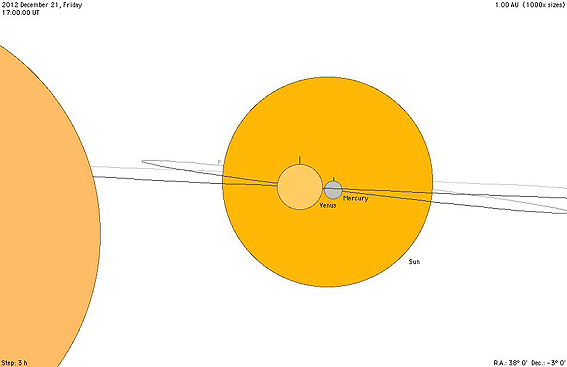
The above image is from a desktop Orrery (see link below) it shows a conjunction of Venus and Mercury at the intersection of their inclined orbits. The date is July 11 1982. The monthly sunspot figure for that month was 90, the highest last century! Below is the situation at 21st December 2012 at the inclination crossover point on the other side of the sun. Also in the image is Saturn forming a further conjunction with both of them. At more or less this time Jupiter is forming a conjunction with Earth and just to make a full house Neptune is making a conjunction with Mars.
As for Jupiter’s Dance…you’re invited