Synodic Cycles of Jupiter and the other planets of the Solar System
Introduction
Movements of the planets and potential influences on the Solar activity cycle.
Review
The earlier work by P D Jose (1) on a 178.7 year solar activity cycle, and I Charvatova (2) regarding a 2402 year solar activity cycle, showed long term periodicity in the Sun’s movement around the Solar System Barycentre and related cold and warm climate periods. A further 4627 year period consisting of 2402 years and 2225 year periods was also considered (3). This paper is to focus on the influences that may create the 11.171 year Wolf and 22.235 year Hale cycle in solar activity as well as linking with the longer periods.
Material
Each of the planets forms a synodic cycle with Jupiter which contains the largest mass and magnetic field of all of the Solar System planets.
Each of the planets form close to a whole number of synodic cycles around their orbits with a fairly small amount of prograde or retrograde motion.. In each case we are looking at the number of synodic cycles taken to complete a whole orbit. As the synodic cycles are only an average time the variation between each cycle and thus the exactitude of each cycle is not considered here. A figure is included for each cycle to show the average difference.
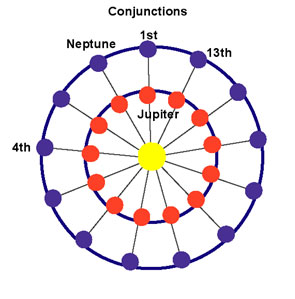
Neptune and Jupiter have 13 synodic cycles taking 12.782 x 13 = 166.168 years (see diagram).
188 cycles are timed at 2403 years. 13 synodic orbits 166.168
Neptune’s orbit 164.785
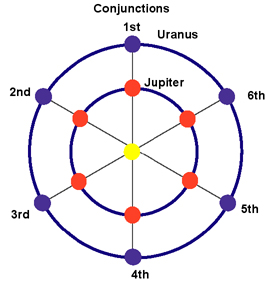
Uranus has six synodic cycles of 13.81 years taking 82.87 years to complete six conjunctions around its orbit (see diagram).
It takes 174 cycles to complete 2403 years.
6 synodic orbits 82.8717
Uranus’ orbit 84.0106
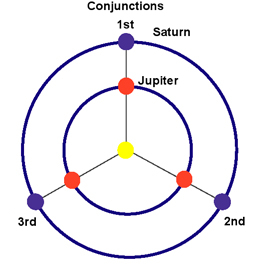
Jupiter and Saturn have three synodic cycles to a basic unit of three conjunctions taking 59.5742 years (see diagram).
9 conjunctions equals 178.7226 years
121 cycles equals 2402 years. 112 cycles equals 2225 years. 233 cycles equals 4627 years.
The conjunctions occur in reverse order.
3 synodic orbits 59.5742
2 Saturn orbit’s 58.9133
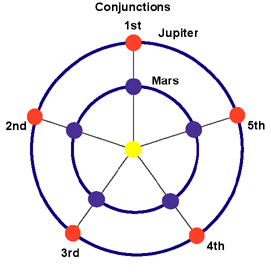
Mars and Jupiter form five conjunctions taking 11.1772 years (see diagram).
80 such conjunctions form a cycle of 16 x 11.1772 = 178.8352 years.
215 x 11.1772 cycles equals 2403.01 years.
5 synodic orbits 11.1772
Jupiter’s orbit 11.8617
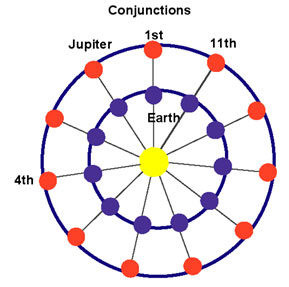
Earth and Jupiter form a basic cycle of 11 conjunctions at 1.0921 of 12.0127 years. (see diagram).
2200 synodic cycles equals 2403.808 years.
11 synodic orbits 12.0127
Jupiter’s orbit 11.8617
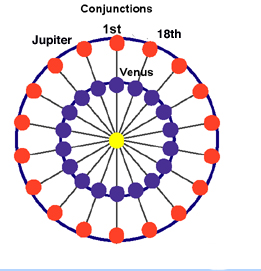
The Venus and Jupiter cycle produces 18 synodic cycles in one orbit over a period 0.6488 x 18 = 11.679 years.
18 synodic cycles 11.679
Jupiter’s orbit 11.8617
Mercury and Jupiter form 48 cycles in 11.800 years
Jupiter’s orbit 11.8617
With the synodic period at 0.2458 years.
Conclusion
Mars and Jupiter are phased so that the five conjunction cycles of 11.177 years occur 16 times in 178.83 years. This may in some way define the sixteen peak solar activity cycle which we recognise. The 11.177 year cycle is close to the recognised sunspot frequency of 11.171 years. The overall 178.832 year cycle is close to the recognised 178.730 year period of sunspot cycles. The close to transit period for Mars and Jupiter is 35.765 years (16 synodic cycles), five such periods equals 178.825 years.
Two further notable points are that the periapsis of Mars is the first in orbital direction compared to the remaining planets and that Mars’ orbit is considerably elliptical thus its tidal force on the Sun is virtually doubled from apoapsis to periapsis.
To follow on from the conclusions posted above: Each Jupiter and Mars conjunction and opposition were numbered in sequences of ten (11.171 years avg.) throughout the sunspot record 1749-2009. Each position was then averaged for the entire period.
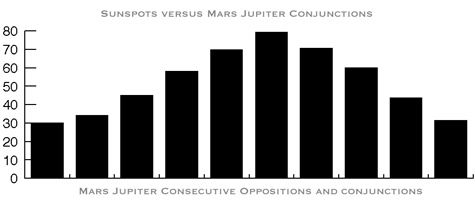
Whilst the sample shows a uniform peak centred on the 11.171 year period this feature might be dismissed as simply coincident upon the existing sunspot peak frequency. However, measuring the distance of Mars from the sun in AU at conjunction only, shows a notable imbalance with a lower sunspot count for the closer approach and a higher count for a distant approach.
Range 1.3814 – 1.6659 = 52.43
Range centre = 1.52365 AU
Less than 1.52365 AU = 43.91
More than 1.52365 AU = 61.71
Distance Variation Percentage 17.08
A look at the Jupiter distance for the sample:
Range 4.9456 – 5.4540 AU = 52.43
Range centre = 5.1998 AU
Less than 5.1998 AU= 45.35
More than 5.1998 AU= 58.44
Distance Variation Percentage 9.33

(Click on graph for larger version)
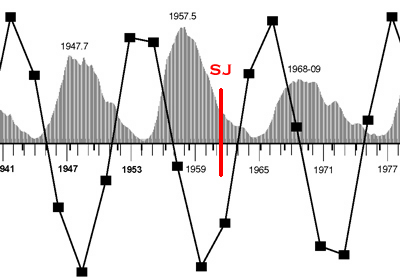
The graph depicts the latitude of Mars at conjuncton with Jupiter set against the sunspot record. As expected we do not see a precise alignment of the sunspot record with the relatively regular rise and fall of the Mars and Jupiter conjunctions. The alignments are seen to drift both away from and towards the latitude peaks not randomly but in gradual steps. This advancing and retardation of the maxima relative to the relatively consistent Mars and Jupiter alignments is suggestive of a relationship between the sixteen peak sunspot cycle and the Mars and Jupiter conjunctions.
 Saturn Jupiter Conjunctions
The above graph shows a representation of the solar distance of Saturn whilst at conjunction with Jupiter. The one notable feature shows that Saturn at its greatest solar distance coincides with the minima between peaks at the four data points shown (the vertical bars are to aid here). The period between the three data points is 178.659 years raising the possibility that Saturn and Jupiter thus punctuate the solar cycle. There are some notable similarities in the solar peaks surrounding the Saturn maximum distance. In two of the cases (sections are shown below) the reverse latitude peak occurs one peak before Saturn is at maximum distance, the following peak is high with a slow decay and the next peak is diminished and also with a slow decay. Solar cycle 24 would be expected to end at around 2021 as the next data point in the series shows…
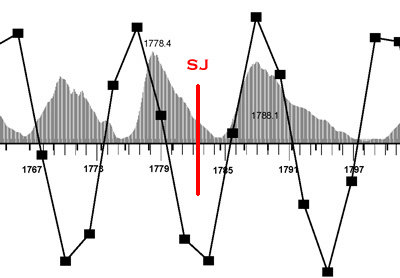
The starting position for Saturn for the initial synodic cycle with Jupiter is close to its perihelion, with Jupiter moving away (the left hand margin). The end position of this synodic cycle is two solar peaks later with Saturn close to its aphelion and with Jupiter coming to conjunction. (red bar). This is close to the longest synodic cycle Jupiter and Saturn can produce in each case.
It is also noted that the second peak occurs some four to six years before the actual Saturn and Jupiter conjunction. It is a possibility that as the most potent Jupiter and Saturn conjunction approaches so a similar process is occurring with all of the other planets. Considering specifically the inner planets. As Mars approaches Jupiter; Earth, Venus and Mercury form multiple conjunctions with increasing rapidity with Mars, Jupiter and Saturn in sequence. Mars takes a little over 2 years to complete its Jupiter conjunction cycle and it appears the optimum position occurs when Mars is around 60-70 degrees from Jupiter and Jupiter 60-70 degrees from Saturn. This happens about two Mars and Jupiter synodic cycles earlier than the actual conjunction point with Jupiter and Saturn. Once the angle between Jupiter and Saturn begins to close the optimum is passed and the peak is decaying.
The researcher Timo Niroma (4) demonstrated the bi-modal nature of the sunspot peak with a probability distribution graph showing two peaks one at 10.38 years and a second at 12 years. Similar figures have been produced by Ray Tomes (5) another researcher of solar cycles.
This can be explained by the synodic cycles of the inner planets with Jupiter as follows:
Earth Jupiter synodic cycle = 1.0921 years
1.0921 x 11 = 12.031 years (11 is a prime)
Venus Jupiter synodic cycle = 0.6488 years
0.6488 x 16 = 10.3808 years (16 is a square)
Mercury Jupiter synodic cycle = 0.2458
0.2458 x 49 = 12.0442 (49 is a square)
0.2458 x 42 = 10.3236
Mars Jupiter synodic cycle 2.23544
2.23544 x 5 = 11.1772 (5 is a prime)
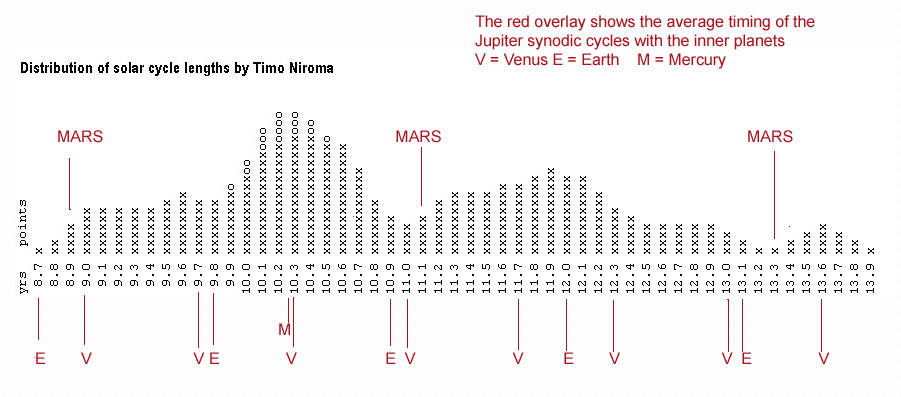
The graph above shows how the timing of the various inner planet conjunctions with Jupiter align with the distribution of solar cycle lengths. This provides a clear indication of the impact of the planetary positions on the solar cycle. It further shows a clear relationship of the planets with Jupiter rather more so than with each other.
To conclude: There is evidence that Mars is influential in the 16 peak 178 year sunspot record although its signature is overwhelmed at intervals by the positions of the outer planets according to a slowly shifting pattern. The inner planets show a closely timed positioning with regard to the bi-modal nature of the sunspot cycle which can be enhanced by the further optimum timing of Mars, Jupiter and Saturn. The evidence indicates a clear relationship of the planets with Jupiter in their influence on the Solar activity cycle. It was always Jupiter’s Dance.
This demonstrates why the bi-modal peaks of the 16 peak sunspot cycle oscillate around the Mars conjunction period. The fine tuning of the highest solar peaks occurs as the Earth, Venus and Mercury conjunctions are progressively subdivided in sequence.
Whilst the foregoing work implicates the collective motion of the planets in the solar cycle I have made no reference to what the process of interaction might be. The main contenders under consideration have been tidal effects, changed movement around the solar system barycentre and an electromagnetic connection via the Interplanetary Magnetic Field. Or, indeed, a combination of these elements.
The work by I. Charvatova, Theodor Landscheidt, P D Jose, Geoff Sharpe and others have shown that disordered motion of the sun around the barycentre accompanies reduced solar activity and disordered timing of the solar cycle. It implies either a process caused by that motion or a process that occurs when planets are so positioned to cause that motion.
Ian Wilson has show correlations between a spin-orbit coupling and the solar cycle demonstrating a potential existence of tidal connections with the sun both at surface level and subsurface.
Recent work by Roy Martin has involved the reworking and extension of the Ching Cheh Hung paper on Venus, Earth and Jupiter alignments [6]. Using a tidal index built upon those VEJ movements it has shown a very close correlation with solar activity. There remain some deviations from the alignments with the solar cycle nonetheless. The timing of those movements coincide, not surprisingly, with the figures derived for synodic cycles between Jupiter and both Earth and Venus that were outlined earlier in reference to the bi-modal aspect of the solar cycle. Hung’s original paper showed a positional influence on the production of solar flares.
The Interplanetary Magnetic Field (IMF)
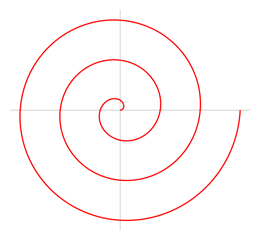
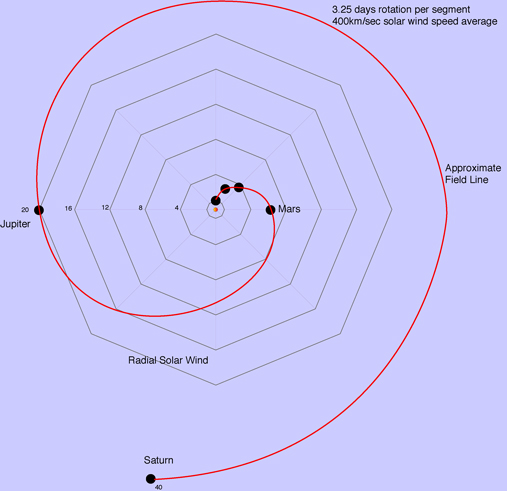
The IMF extends out from the sun as a spiral structure of field lines. This is termed the Parker Spiral and it is an Archimedes Spiral meaning that the ring spacing is equal rather than a logarithmic or Fibonacci spiral which is self replicating and exponential (as shown below).
The Parker Spiral is caused by the solar field lines embedding themselves in what is termed the slow solar wind. This is a stream of particles streaming from the sun at an average speed of 400Km/sec. Due to the rotation of the Sun, approximately 26 days at the equator, the solar wind trails behind the sun’s rotation as it moves out in spiral bands of plasma. Thus the IMF field lines have a spiral structure. The speed of the wind though can vary and in this has a somewhat cyclical occurrence. The increase in solar wind activity at solar minimum has been used as a prediction tool for the subsequent maximum although its apparent accuracy over the past dozen cycles has failed as the SC23 cycle has extended and SC24 cycle has yet to occur. At higher latitudes on the Sun the solar wind increases in speed.
When describing the positions of the planets at the extreme peaks of the solar record 1778 and 1958 it can be seen that the planets arc backwards to their orbital direction from the innermost planets outward. The description made earlier, although slightly misconceived, suggests that in order to ‘align’ for the solar peaks the planets need to be positioned along an arc although it seems at first that the outer planets are out of synch with this process. Any positional repeat between two planets of course conforms to the synodic period in the same way as a conjunction.
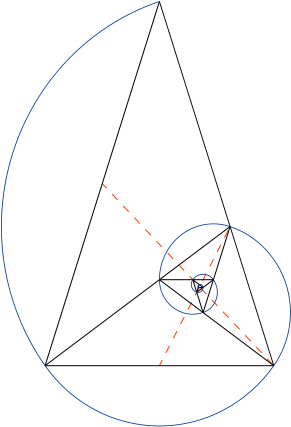
A further clue comes from the remarkable occurrence of Fibonacci numbers in the whole orbit relationships between the planets and also their synodic cycles. These cycles have been noted before and being that they are related to a naturally occurring process are always in a progressive state attempting to achieve a harmony relative to their environment. Indeed, their relative positions to each other form an harmonious structure. The orbital positions which approximate to Bode’s Law also fit with the Fibonacci sequence harmoniously. This would explain why the Fibonacci sequence is so prevalent in the orbital timings and synodic cycles. It means essentially that the planetary distances are logarithmic relative to the Parker Spiral. This is the crucial point.
Images Wikipedia
Roger Tallbloke has taken the tidal values of Venus, Earth and Jupiter, as collated by Roy Martin, and applied a correction to the data based on the solar wind speed. This achieves a better alignment with the solar cycle than the raw data could. It considerably increases the case for a correlation related to the sun’s magnetic field lines.
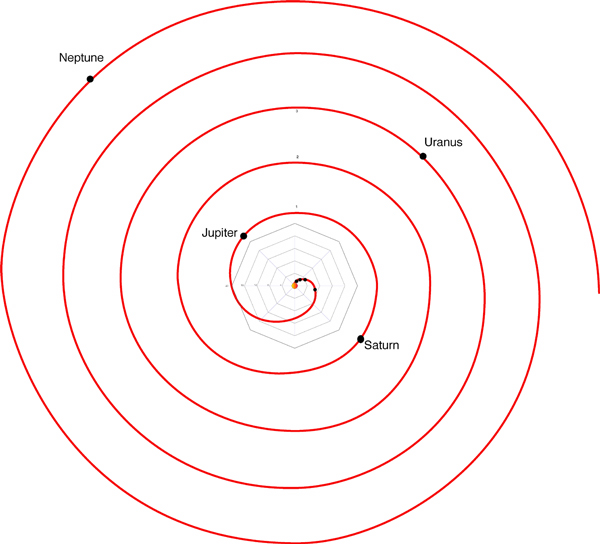
Looking again at the planetary positions at the time of the solar peaks previously examined it can be seen that the planets adopt a specific position on the Parker Spiral at the time of the solar maximum peaks. The diagram below shows how the field line wraps its way around the Sun and causes a peak ‘reconnection’ when all of the planets align along it. The slow solar wind is represented by the octagonal segments moving outwards in equal bands whilst the planetary positions are dictated by the number of days the solar wind takes to reach them. It is thought that the solar field lines transmit through the planetary positions as a series. The diagram however can only be considered as an approximate guide to the optimum positions due to the elliptical nature of the planetary orbits and uncertainties in the solar rotational rate and solar wind speed.
Overall this would explain the close timing of Mars to the solar cycle as it becomes the ‘bridge’ to Jupiter from the innermost planets. The marked ovality of its orbit would be a factor in its position relative to the spiral field lines and the other planets with its slower transition speed a factor in the strength of the ‘reconnection’. This specific feature is in part the cause of what is essentially a small planet being prominent in the solar cycle timing.
It should be noted that Uranus and Neptune are also included in this spiral, Uranus being three coils of the field lines further out and Neptune being over four coils of the spiral away from the point where the field lines made their solar exit. Over long time scales their position affects the extent of the connection into the outer solar system. Neptune is about six times further out compared to Jupiter’s position. This explains why at the peak solar activity periods the outer planets seemed in the ‘wrong’ position when in fact they were well positioned with regard to the Parker Spiral
Solar wind speed 1440000 km per hour
Solar wind speed 34,560,000 km per day
Mercury Aphelion 69,816,900 km – Perihelion 46,001,200 km
Venus Aphelion 108,942,109 km – Perihelion 107,476,259 km
Earth Aphelion 152,098,232 km – Perihelion 147,098,290 km
Mars Aphelion 249,209,300 km – Perihelion 206,669,000 km
Jupiter Aphelion 816,520,800 – Perihelion 740,573,600 km
Saturn Aphelion 1,513,325,783 km – Perihelion 1,353,572,956 km
Uranus Aphelion 3,004,419,704 km – Perihelion 2,748,938,461 km
Neptune Aphelion 4,553,946,490 km – Perihelion 4,452,940,833 km
The aphelion to perihelion difference for Neptune is less than three days solar wind travel time or less than an eighth orbital distance. This would bring the position of the planets forward anti-clockwise. In the case of Mars the difference is 1.23 days. The following timings are to aphelion of the respective planets using a Carrington rotation as the optimum Solar rotational period.
Sun to Mercury time 2.02 days
Sun to Venus time 3.15 days
Sun to Earth time 4.40 days
Sun To Mars time 7.21 days
Sun to Jupiter time 23.62 days = Carrington rotations 1.154
Sun to Saturn time 43.78 days = Carrington rotations 1.605
Sun to Uranus time 86.93 days = Carrington rotations 3.18
Sun to Neptune time 131.76 days = Carrington rotations 4.831
Note that astrophysical literature does not typically use the equatorial rotation period, but instead often uses the definition of a Carrington rotation: a synodic rotation period of 27.2753 days (or a sidereal period of 25.38 days). This chosen period roughly corresponds to rotation at a latitude of 26 deg, which is consistent with the typical latitude of sunspots and corresponding periodic solar activity. When the Sun is viewed from the “north” (above the Earth’s northern pole) solar rotation is counterclockwise. Sunspots viewed from Earth (its Northern hemisphere) appear to move from left to right across the face of the Sun.
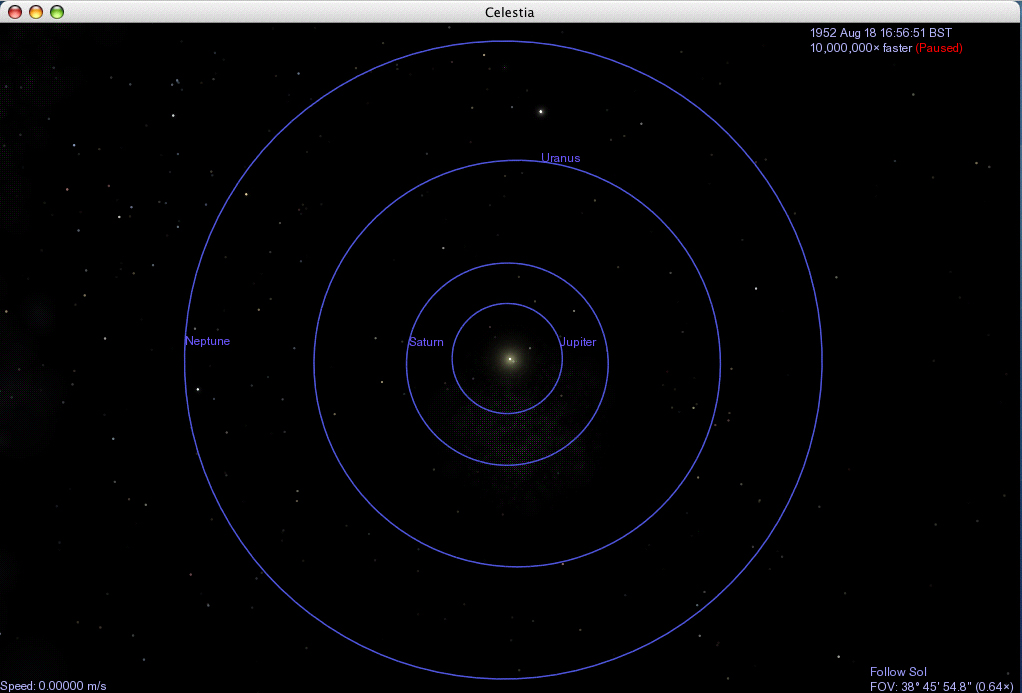
The following illustration shows the positions of the Gas Giants at the beginning of their optimum positioning:
Below are the positions of the planets immediately beforeand after the 1778 and 1958 peaks.
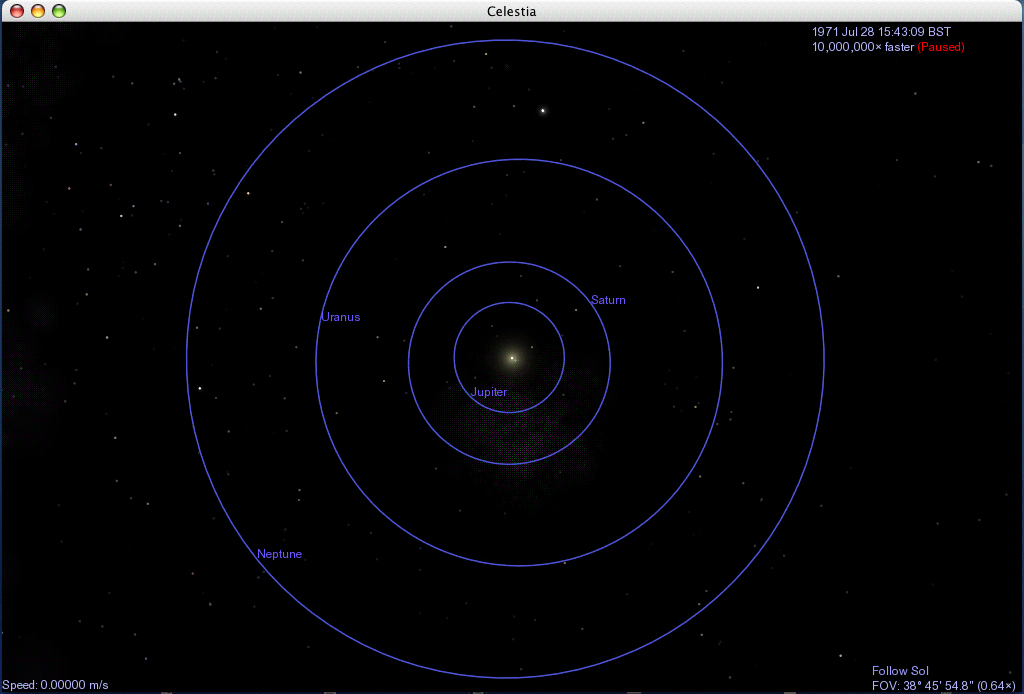
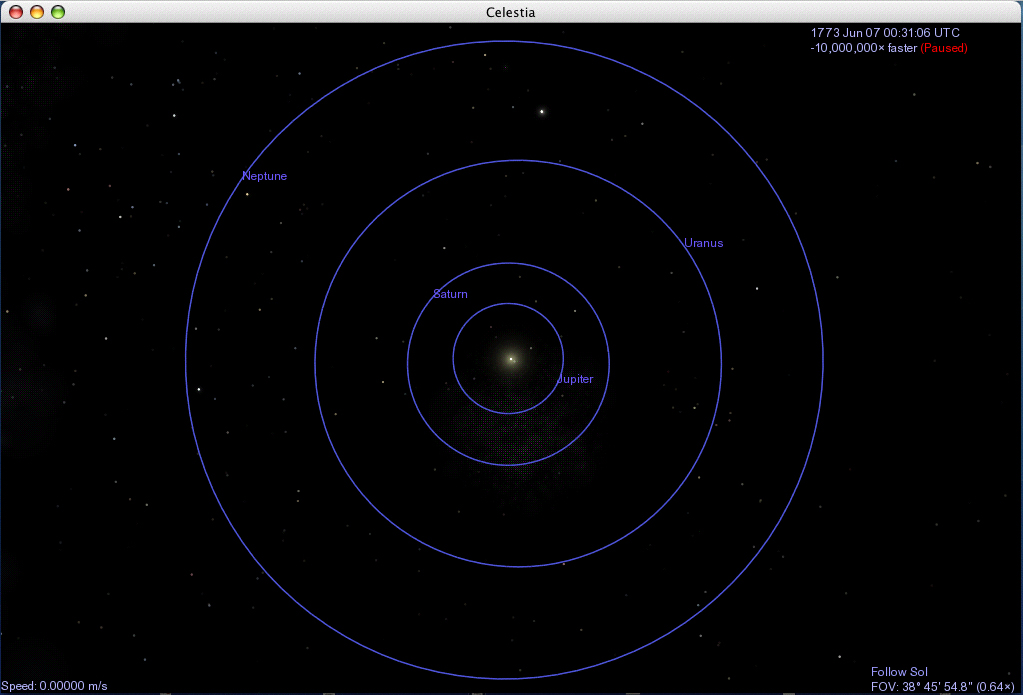
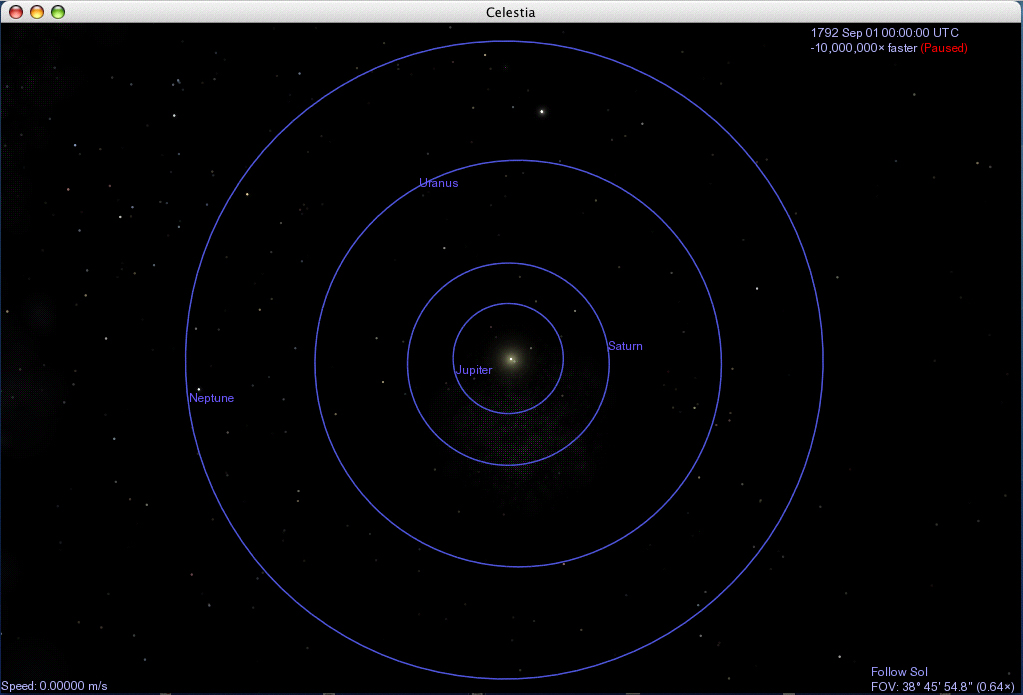
The images for 1792 and 1971 show the outer planets at their final position before the ‘connection’ fades and in both instances are positioned on the extended downslope of the third peak.
How then do the planets produce weakened and mistimed peaks during the remainder of the solar cycle? It occurs that the planets cannot all align along the field lines in a complete sense and thus a weakened connection is formed by the best positioned.
It is possible that a close proximity of the planets to the field lines induces an increasing flow of solar wind and is thus associated with increasing solar activity. The proposal is that in order for the IMF to connect, the solar wind begins to increase until the field lines ‘reach’ out to the linkage between the planets.
It was always the hope that an investigation of planetary motion would lead to an understanding of how those positions affect the solar cycle. We have now the evidence of planetary motion being inextricably tied to the solar cycle via a reconnection link guided by the solar field lines embedded within the solar wind.
References:
Thanks to Roger Tallbloke for advice, encouragement and a constant supply of relevant information through his blog at: http://tallbloke.wordpress.com/
(1) Paul D Jose – Sun’s Motion and Sunspots (1965) – http://adsabs.harvard.edu/full/1965AJ…..70..193J
(2) I. Charvatova – Can origin of the 2400 year cycle of Solar activity be caused by Solar Inertial Motion? Geophysical Institute Prague, Czechoslovakia.
(3) Planetary Motion and Solar Activity – are they linked? – http://www.jupitersdance.com/TheLastTango/
(4) Timo Niroma http://personal.inet.fi/tiede/tilmari/sunspots.html#tdist
(5) Ray Tomes Cycles Research Institute http://cyclesresearchinstitute.wordpress.com/
(6) Roy Martin -Relations Between Solar Activity and Solar Tides Caused by the Planets Defined – http://tallbloke.files.wordpress.com/2010/08/solartidalinfluencesofvej_w01.pdf
gray@jupitersdance.com
Copyright Jupiter’s Dance January 31st 2010. Updated August 29th 2010. Corrected and edited January 14th 2011. Author Gray Stevens