However, the trends remain and there are significant Earth and Solar changes being witnessed. As of the date this is being written, August 2009, we are in a prolonged sunspot minimum not seen for at least a century. The planet continues to see large scale earthquakes at low sunspot frequencies, and growing volcanic activity is producing SO2 and aerosol clouds in the Northern Hemisphere. The most recent of these larger eruptions has been Sarychev Peak in the Kuril Islands, the astonishing photograph below was taken by astronauts on the Space Station June 12th 2009. Previous temperature minima featured such eruptions.

A 2004 study published in Nature estimated that between 15 and 37% of known plant and animal species will be ‘committed to extinction’ by 2050, a statement that makes you wonder whether homo sapiens are included in the percentages. We should be paying attention.
The IPCC suggests values of $78 billion to $1141 billion annual mitigation costs for global warming, or up to 3.5% of current world GDP (which was around $35 trillion pre-recession). Since expert bankers have taken us to the brink of financial collapse, could scientific expertise be taking us into a climate change fiasco.
Introduction
‘
The British Royal Astronomer John Flamsteed, appointed in 1675, accurately calculated the solar eclipses of 1666 and 1668. ‘A Measure of the Solar Rotation During the Maunder Minimum’, a scientific paper by J M Vaquero in 2002 (7) noted the solar rotation rate, derived from an analysis of Flamsteed’s drawings of sunspots, shows a decrease during the deep Maunder minimum (1666–1700). The Maunder minimum was an intense period of cold lasting from 1620 to 1710.
Flamsteed is also remembered for his conflicts with Isaac Newton, the President of the Royal Society at that time. Newton himself, with the theories of universal gravitation and the three laws of motion to his credit, noted that the Sun is engaged in continual motion around the centre of mass of the solar system as a result of the gravitational force of the planets. It sounds rather like a hammer thrower rotating with his ball on a chain, each exerting force on the other. Thus the Sun loops in a orbit around the Solar System Barycentre and occasionally, as a result of independent planetary movements, leaves its normally smoothly executed loops for a somewhat disordered period of motion. The disordered periods coincide with temperature minima on Earth.
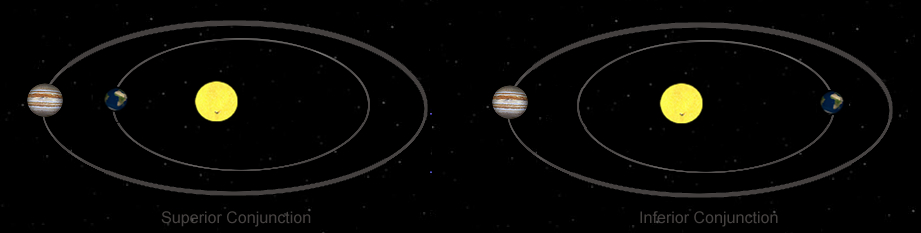
Various scientists studied this phenomenon and its relation to solar activity and climate whilst the mainstream eventually took up the theory of a self-generating solar activity cycle. The scientists also linked this solar movement and activity to the conjunctions of planets, very often being accused of following astrology. The synodic period is the time it takes for two planets to return to the same relative positions, from superior conjunction (hereafter conjunction), to inferior conjunction (hereafter opposition) and back to superior conjunction giving their synodic period. Remember that both planets are moving, with the inner planet moving faster than the outer planet. (see diagram below) thus the synodic period can only ever be an average time.
Review
A paper by the late Rhodes Fairbridge entitled “Rhodes Fairbridge and the idea that the solar system regulates the Earth’s climate” – provides an excellent overview of earlier work in the field and makes a prediction of a period of global cooling at the beginning of the 21st century.
Reference should also be made to a paper by IGR Wilson and his description of a Spin-Orbit coupling between planets (1). This describes how planetary pairs exert a drag and then an acceleration on the Sun as they orbit between conjunction and inferior conjunction (refered to as opposition). The acceleration as the inner planet travels towards the outer planet and drag as it travels away from the outer planet. This effect is thought to change the rotational speed of the Sun’s surface layers and thus alter the solar activity cycle.
Ching-Cheh Hung, of the Glenn Research Center, also proposed a theory of peak tidal effects on the Solar surface in his paper discussing alignments of the inner planets.(3) The paper also shows correlation between conjunctions and solar flare activity.
Ivanka Charvatova 2000 (2) in her paper described a cyclicity in the Solar Inertial Motion over a period of 2402.2 years which exhibited harmonious motion during a 370 year warm periods that correlate with various temperature proxies over 6 millenia. She further links disordered movement of the Sun around the Solar System Barycentre with known temperature minima.
Reference should be made to Vladimir Ladma’s website (5) and description of a 4627 year ‘all synod’ period which describes the planets all conforming to a cycle of this duration. On this webpage is a listing of data relating to solar activity cycles and various correlations.
There also remain viable alternative theories relating to the magnetic pull on the Sun’s core and the ability of the planets to affect the Solar Cycle due to their latitude above or below the Solar plane.
All four of the mentioned papers predict a cool period in the early part of the 21st Century.
One of the great difficulties has been to determine a mechanism by which the gravitational pull of the far flung planets overcomes the massive localised gravity of the the Sun and it remains a serious deficit in the various theories.
Rhodes Fairbridge also drew attention to a fly-by of the solar poles in 2007 of the solar orbiter Ulysses where he suggested an expectation of a disordered and weakened solar magnetic field structure. The following images from that now defunct satellite show the veracity of that prediction. Nasa Image
Given the agreement of the papers, though each with a different emphasis it seemed worthwhile to try to advance understanding of the potential means by which planetary movements might dictate solar activity.
Material – Part1
I produced the following graphs showing synodic period changes at the time of conjunction and inferior opposition for the four outer planets, Neptune, Uranus, Saturn and Jupiter. They depict the acceleration and deceleration of the planetary pairs as they rise and fall over long time scales and which potentially relate to the solar activity cycle. The differences in the synodic period varies according to the eliptical nature of the planet orbits and the changing velocity of the planets around their respective orbits. As such they give a visual interpretation of potential tidal/torque effects on the Solar surface.
The graphs suggest that individual pairs of planets produce cycles related to the synodic periods primarily of Jupiter and Saturn with interrelated timing. As such they offer an insight into long term Solar variability and its potential connection with our climate, geothermal activity and magnetosphere. The synodic periods are dated, the y axis is the orbital difference in years from the preceeding period.
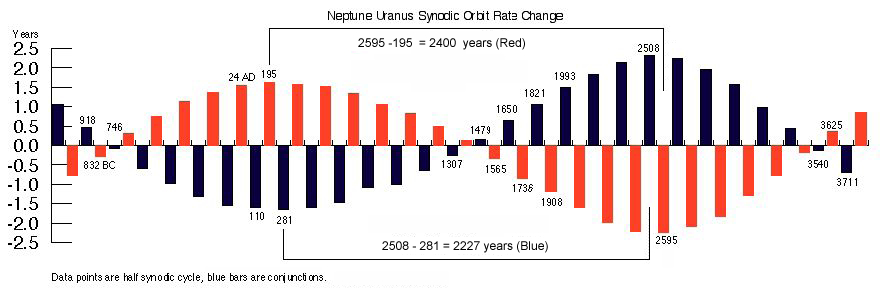
The graph is of a section of the Neptune and Uranus synodic cycles (918 BC to 3711 AC). The cycle shown gives a timing of 14 synodic periods between peak oppositions and 13 synodic periods between peak conjunctions. This is consistent with 27 synodic periods for the 4627 year period and amounts to 233 Jupiter and Saturn synodic periods. The next cycle should produce a reversal of the timing between peak conjunctions and peak oppositions.
Relating this to Charvatova’s 2402 year period of stable and warm temperatures, it seems a 2224 year period consisting of 13 UN synodic periods (112 JS periods) and a 2403 year period consisting 14 UN periods (121 JS periods) make up the total 4627 period. This does not mean that the peaks shown coincide with a climate change feature necessarily but that the periodicity can be visualised as potential torque or tidal effects. A continuation of the graph would show more precisely how this progresses. Some caution should be shown in extrapolating the graphs forward and back in time as there is a slow variation in synchronicity as the cycles progress.
Data extracted from Celestia (6).
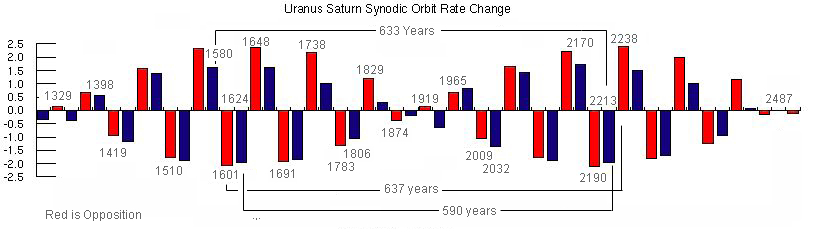
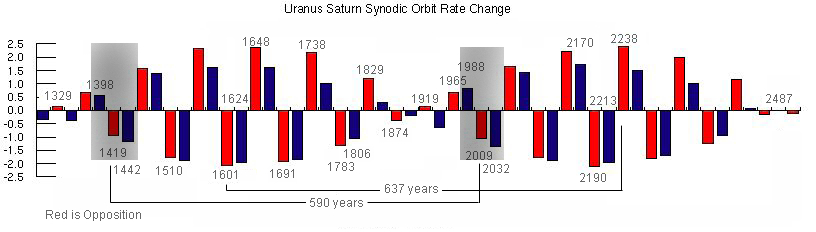
The above graph shows the changes in synodic periods of Saturn and Uranus. The motion is different to NU as Saturn’s orbital time is 29.45 years to Uranus at 84.01 years, a different ratio to NU. A cycle of approx 1157.5 years is shown indicating 102 US synodic cycles in 4627 years. The two periods of 2402 years and 2225 years seen in the NU graph also produce 53 and 49 synodic cycles for Uranus and Saturn with an alternating structure similar to NU. The graph shows a range of approximate timings; 546 years, 590 years and 633 years between peak conjunctions and peak oppositions. One notable feature is the potential for the 590 year period to exist between conjunction peaks or opposition peaks on the same side of the y-axis for example 1624 and 2213, and 1648 and 2238.
2402 / 45.3602286 = 52.95
2225 / 45.3602286 = 49.05
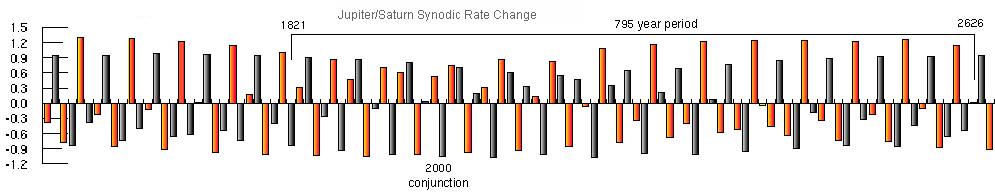
The above graph shows the synodic period changes for Jupiter and Saturn. The cycles are complex with a slowly evolving pattern emerging based on three synodic periods. The periodicity being 3 x 1542.3 years to one 4627 year period or 233 JS synodic periods. The period marked is the length of time needed for Saturn to return to almost the same position on its orbit relative to Jupiter, this relationship will be discussed further.
Analysing the cycle it should be seen that it produces several sub cycles as follows:
2 x 2313 close to Hallstatt solar cycle length of approximately 2300 years which is reflected by climatic events
3 x 1542 close to the 1500 year period Bond climatic events and their Ice Age counterpart Dansgaard-Oeschger events.
4 x 1156.5 close to the cycle periodicity of Uranus and Saturn
27 x 171.366 close to the synodic period of Neptune and Uranus
The basic cycles between the gas giants are thus:
Neptune Uranus is 27 x 171.444 (the synodic period) = 4628.988
Uranus Saturn is 102 x 45.36022 (the synodic period) = 4626.7424
Jupiter Saturn is 233 x 19.85887(the synodic period) = 4627.11671
It is most likely, given that the inner planets also conform to this cycle, that Jupiter is the dominant factor as a result of its immense mass and magnetic field. The two periods of 2402 years and 2225 years are the product of the alternating cycles from fastest to slowest conjunction and fastest to slowest opposition.
Part 2
So, in partial summary, we could say that there is evidence that climate cycles are linked to all three of the synodic periods of the Gas Giants even though, with their synchronised orbital motion, some difficulties arise in isolating which of the cycles might be affecting the climate. It appears that either a tidal or torque effect might be an explanation for a change in solar output, or, that the overall movement of the Sun about the solar system barycentre is implicit in the Sun’s variable output. It is suggested that the distribution of mass of the planets must independently and cyclically vary at these points in order to induce the orderly motion that Charvatova indicates is synonymous with warm temperature periods. However, there remains a potential for latitude, orbital distance and relative speeds of the planets to be a factor in the process.
Charvatova, in her paper, itemised long periods of warm stable weather. It is worth looking at these periods in relation to the Neptune and Uranus graph that was shown earlier.
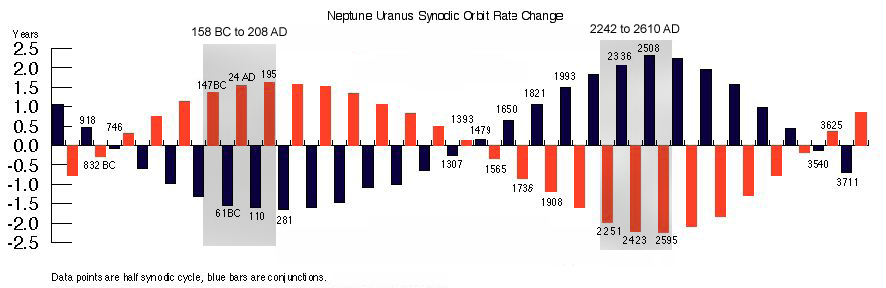
Charvatova stated that the last measured period of high stable temperatures was 158 BC to 208 AD and that the next predicted period would be 2242 to 2610 AD. When these are added to the graph, grey shaded areas, it can be seen that they fit almost exactly the same part of the cycle. The centres about which they are symmetrically placed, are 2400 years apart as Charvatova states and with the involved planets at opposition.
Charvatova also indicated periods of climate minima through her measurements of disordered solar movements about the Solar System barycentre. Compared to the synodic periods of Neptune and Uranus, they too make an interesting correlation.
Wolf 1270…1350 – Conjunction 1307
Sporer 1430…1520 – Conjunction 1479
Maunder 1620…1710 – Conjunction 1650
Dalton 1787…1843 – Conjunction 1821
Current Period 1985…2040 – Conjunction 1993
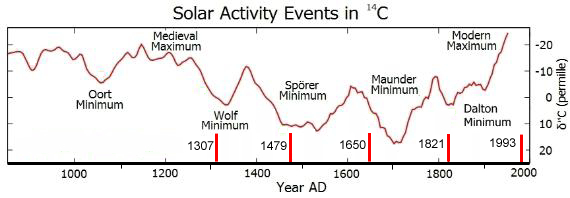
The closeness of these conjunctions to the centre of each period of cold suggest that there is a relationship between the planetary conjunctions and climate variation, probably via Solar activity, as each minimum corresponds with low sunspot activity.
(Whilst this page was in production a web page by Geoff Sharp has been published which details these conjunctions and their relationship with changes in Angular Momentum between the Sun and Solar System Barycentre: Neptune and Uranus Control Grand Minima & Solar Modulation? . He also looks at prior periods of cold and makes a tentative prediction for our current solar minimum. Further to this he relates the positions of Saturn and Jupiter to the Neptune and Uranus conjunctions.)
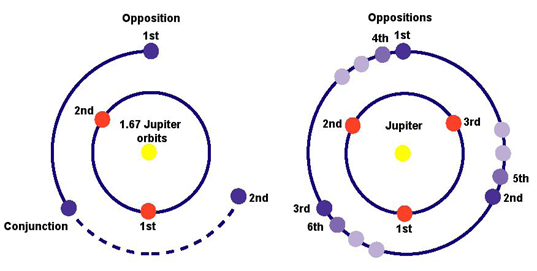
In particular the orbital characterisitics of Neptune and Uranus need to be examined to establish the position of each planet and their relationship with both the cooling and warming periods. Neptune orbits every 164.78 years whilst Uranus orbits every 84.01 close to half the orbital time of Neptune. Because the orbit of Uranus takes close to half the time of Neptune’s, when Uranus returns to its previous conjunction position Neptune is just ahead of opposition.The synodic period is 171.44 years meaning averagely the planets are conjunct 6.66 years after Neptune has completed an orbit. Thus each conjunction occurs sequentially around the orbit of Neptune rather like the divisions on a dial. Please note that in the following diagrams the divisions are not equal as the synodic periods vary and they represent only a visual guide. (diagram of conjunctions below)
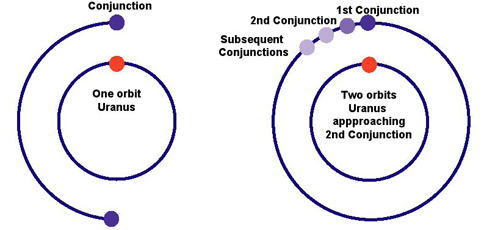
This means that the conjunctions of Neptune and Uranus are consecutive around the orbit of Neptune during a 3600 year cycle. The cycle completing and advancing slightly after 21 conjunctions. The oppositions behave in a similar fashion.
Looking at the oppositions for Uranus and Saturn the movement is quite different with successive oppositions, and similarly conjunctions, occuring at slightly over 180 degrees apart. The cycle completes at approx 590 years with a slight advance around the outer orbit. 2400 / 590 = 4.06 so 4 periods to the Neptune Uranus cycle above. The other period of 2225 years relates to a cycle of 633 years approx with an interesting divisor of 3.5 periods to the 2225 years or alternatively the shorter 546 year period of 2225 / 546 = 4.07. This may create a complex pattern of a quasi-periodic nature and the cycle may hold other timings on further analysis. 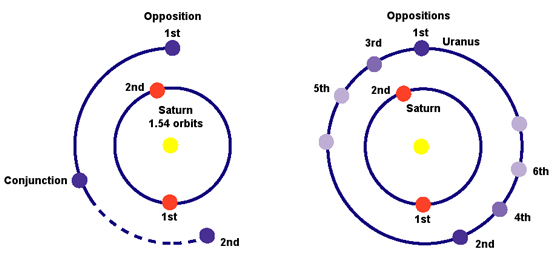
I draw your attention to a period of cold 590 years before our current minimum and have marked them as shaded periods on the Synodic cycle graph. They relate to a period at the beginning of the Sporer 1398 to 1442 marking the decline from a peak into a much cooler period. There are differences in the graph structure at these periods so that only a general inference of similarity can be made.
Looking at the orbits of Jupiter and Saturn the oppositions and conjunctions behave differently because Jupiter completes approx 1.67 orbits before realigning with Saturn. The effect of this is that the opposition position around the orbit of Saturn advances in small steps every approx 20 years but consecutively at three different positions around the orbit 120 degrees apart. (diagram of oppositions below).
The effect of this means that whereas Neptune and Uranus repeat their orbital positions after 3600 years, Saturn and Jupiter do so every approximately 795 years. Close to a third of 2402 years. 40 Synodic cycles 40 x 19.8580709
= 794.322836. So, 121 Synodic cycles 121 x 19.8580709 = 2402.83. The 121st cycle results in a positional shift of 120 degrees relative to Neptune and Uranus completing the 2402 year period.
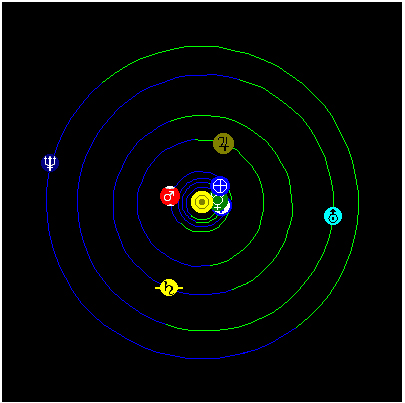
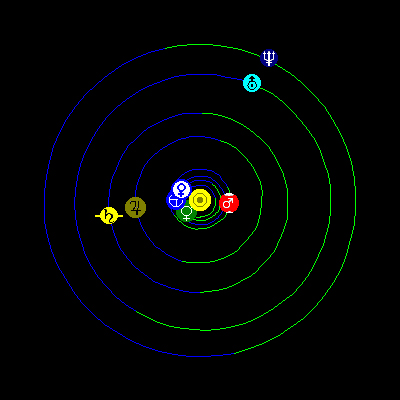
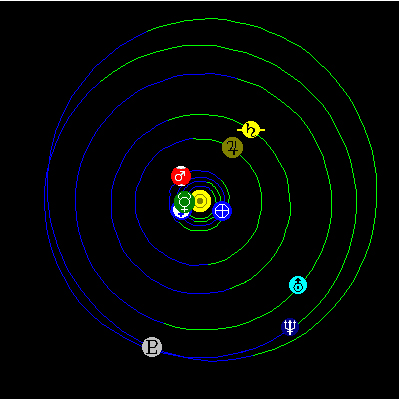
This produces points where the oppositions of Neptune and Uranus coincide with oppositions of Jupiter and Saturn over a 2400 year period. These happen at 2376BC (two years earlier at 2378BC), 24AD (exact), and 2423AD (three years later 2427AD), thus showing the cycles slowly going out of synch. (Diagrams below).
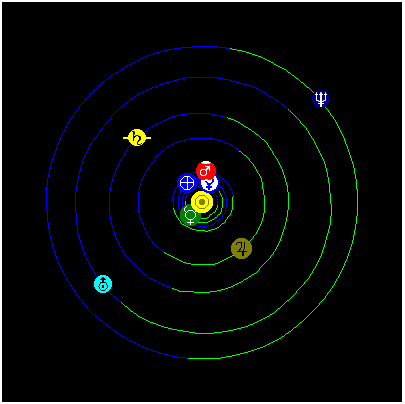
2378BC
24AD
2427AD
When the two oppositions combine you get a stable warm period, remembering of course that 2427 AD is still in the future and the slow changes in synchronicity may affect the outcome.
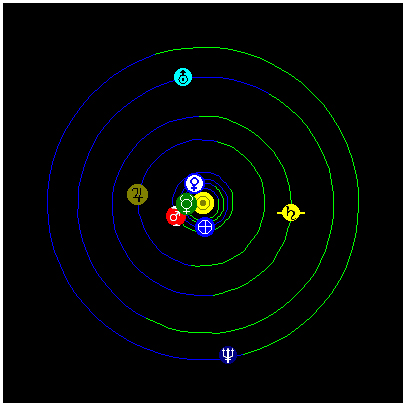
Interestingly, if you look back to 402BC, 2403 years before The Saturn Jupiter conjunction of 2000, the C14 record shows a distinct minimum of a similar depth to the Oort Minimum. The Neptune Uranus conjunction was very close in 402BC but 7 years earlier in the current case.
-402 BC
2000 AD
Conclusion
To conclude it seems that there is a relationship between the planet positions and the movement of the Sun about the Solar System Barycentre which is further linked to Solar output. It also appears that there is an association between these positions and variations in our climate, producing cyclical long-term warming periods and grand minima. The cycles are subject to a slow change in synchronicity and this may account for very long term variations and quasi-periodicity. We do not know the mechanism by which Solar output is changed or whether the relationship detailed is one of several affecting Solar output.
The 3600 year Neptune Uranus cycle synchronises with an approximate 800 year Saturn Jupiter cycle and an approximate 600 year Uranus Saturn cycle. Examination of the synodic couplings of the inner planets may well unveil additional mechanisms that relate to our solar activity cycle.
Solar minima are averagely 60 years in duration so there is some feasibility in the suggestion that the position of Neptune and Uranus around conjunction may synchronise with a series of Saturn Jupiter orbits in succession. With the slow changing of phase determining their potency.
Part 3 (Insert Here)
At the time of writing, August 2009, we are already in a minimum of 700 days duration compared to an average 485 days per cycle, the longest for a hundred years. We do not know at this point how to determine the potential depth of cold we may face and are thus largely unprepared for a reversal of the prevailing weather trend. Our agricultural and energy security are already compromised by global financial problems, changes in land use, and shifting climate patterns. A severe cold period would have catastrophic repercussions, putting pressure on our energy systems and agricultural output combined.
References:
(1) Does a Spin–Orbit Coupling Between the Sun and the Jovian Planets Govern the Solar Cycle? – I.R.G.Wilson, B.D.Carter, and I.A.Waite
University of Southern Queensland, Toowoomba, QLD4350, Australia
(2) I. Charvatova, Can origin of the 2400 year cycle of Solar activity be caused by Solar Inertial Motion? Geophysical Institute Prague, Czechoslovakia.
(3) Ching-Cheh Hung, Glenn Research Center, Cleveland, Ohio Apparent Relations Between Solar Activity and Solar Tides Caused by the Planets
(4) Rhodes Fairbridge and the idea that the solar system regulates the Earth’s climate – Rhodes Fairbridge
(5) Vladimir Ladma Analysis of Synodic Cycles.
(6) Planetary Software: Celestia
(7) Vaquero J.M., Sánchez-bajo F., Gallego M.C. (2002). “A Measure of the Solar Rotation During the Maunder Minimum”. Solar Physics
8) Geoff Sharp (Updated 2009) Neptune and Uranus Control Grand Minima & Solar Modulation? Originally published Nov 2008 http://landscheidt.auditblogs.com
9) Solar System Orrery Images Fourmilab
gray@jupitersdance.com
Copyright Jupiter’s Dance August 28th 2009. Author G. Stevens